Assessing Global Oil and Gas Emissions Intensities
The OCI⁺ quantifies and compares greenhouse gas emissions intensities from global oil and gas assets. Use this web tool’s interactive features to see where methane and carbon dioxide are emitted and investigate ways to reduce energy waste and the life-cycle emissions intensities of production, refining and petrochemical processing, storage, transport, and end uses.

There is No Standard Oil or Gas
Oil and gas are diverse sources of fossil fuel energy. They are found in many different regions and have varied chemical makeups. A wide range of technologies is used to extract, process, and ship oils and gases that are then consumed globally. Estimate the emissions intensities of different oils and gas through their supply chains to uncover inefficiencies, energy waste, and methane leaks.
Map
View the distribution of GHG emissions from a large and growing sample of global oil and gas resources along with visualizations of methane emissions and gas flaring.
View map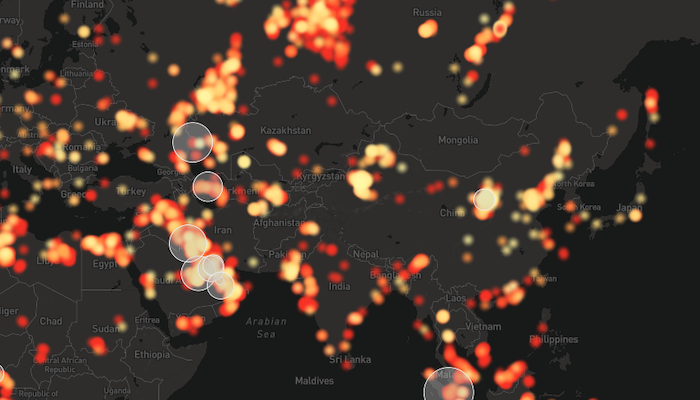
Supply Chain
Profile the GHG emissions that come from upstream, midstream, and downstream oil and gas operations and end uses.
View supply chainAnalysis
Plot the relationships between key oil and gas characteristics and GHG emissions.
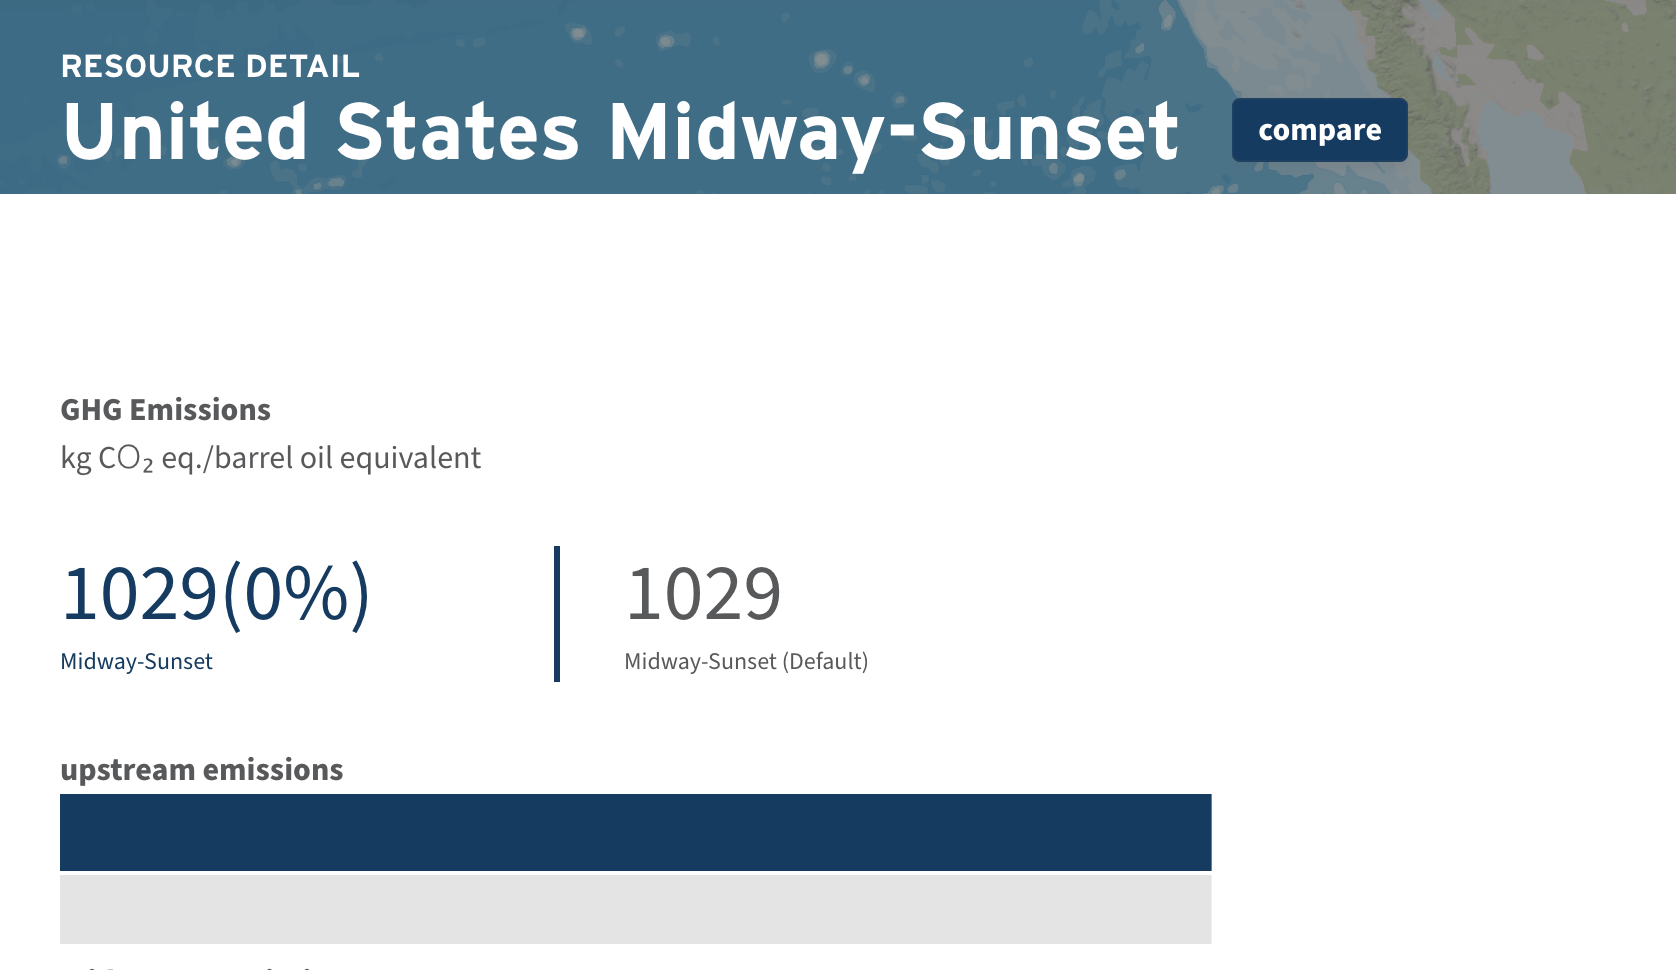
View analysisView Details and Compare Oils and Gases
Profile and compare oils and gases, including their resource characteristics, emissions breakouts, and estimated methane intensities.
View details